Studio
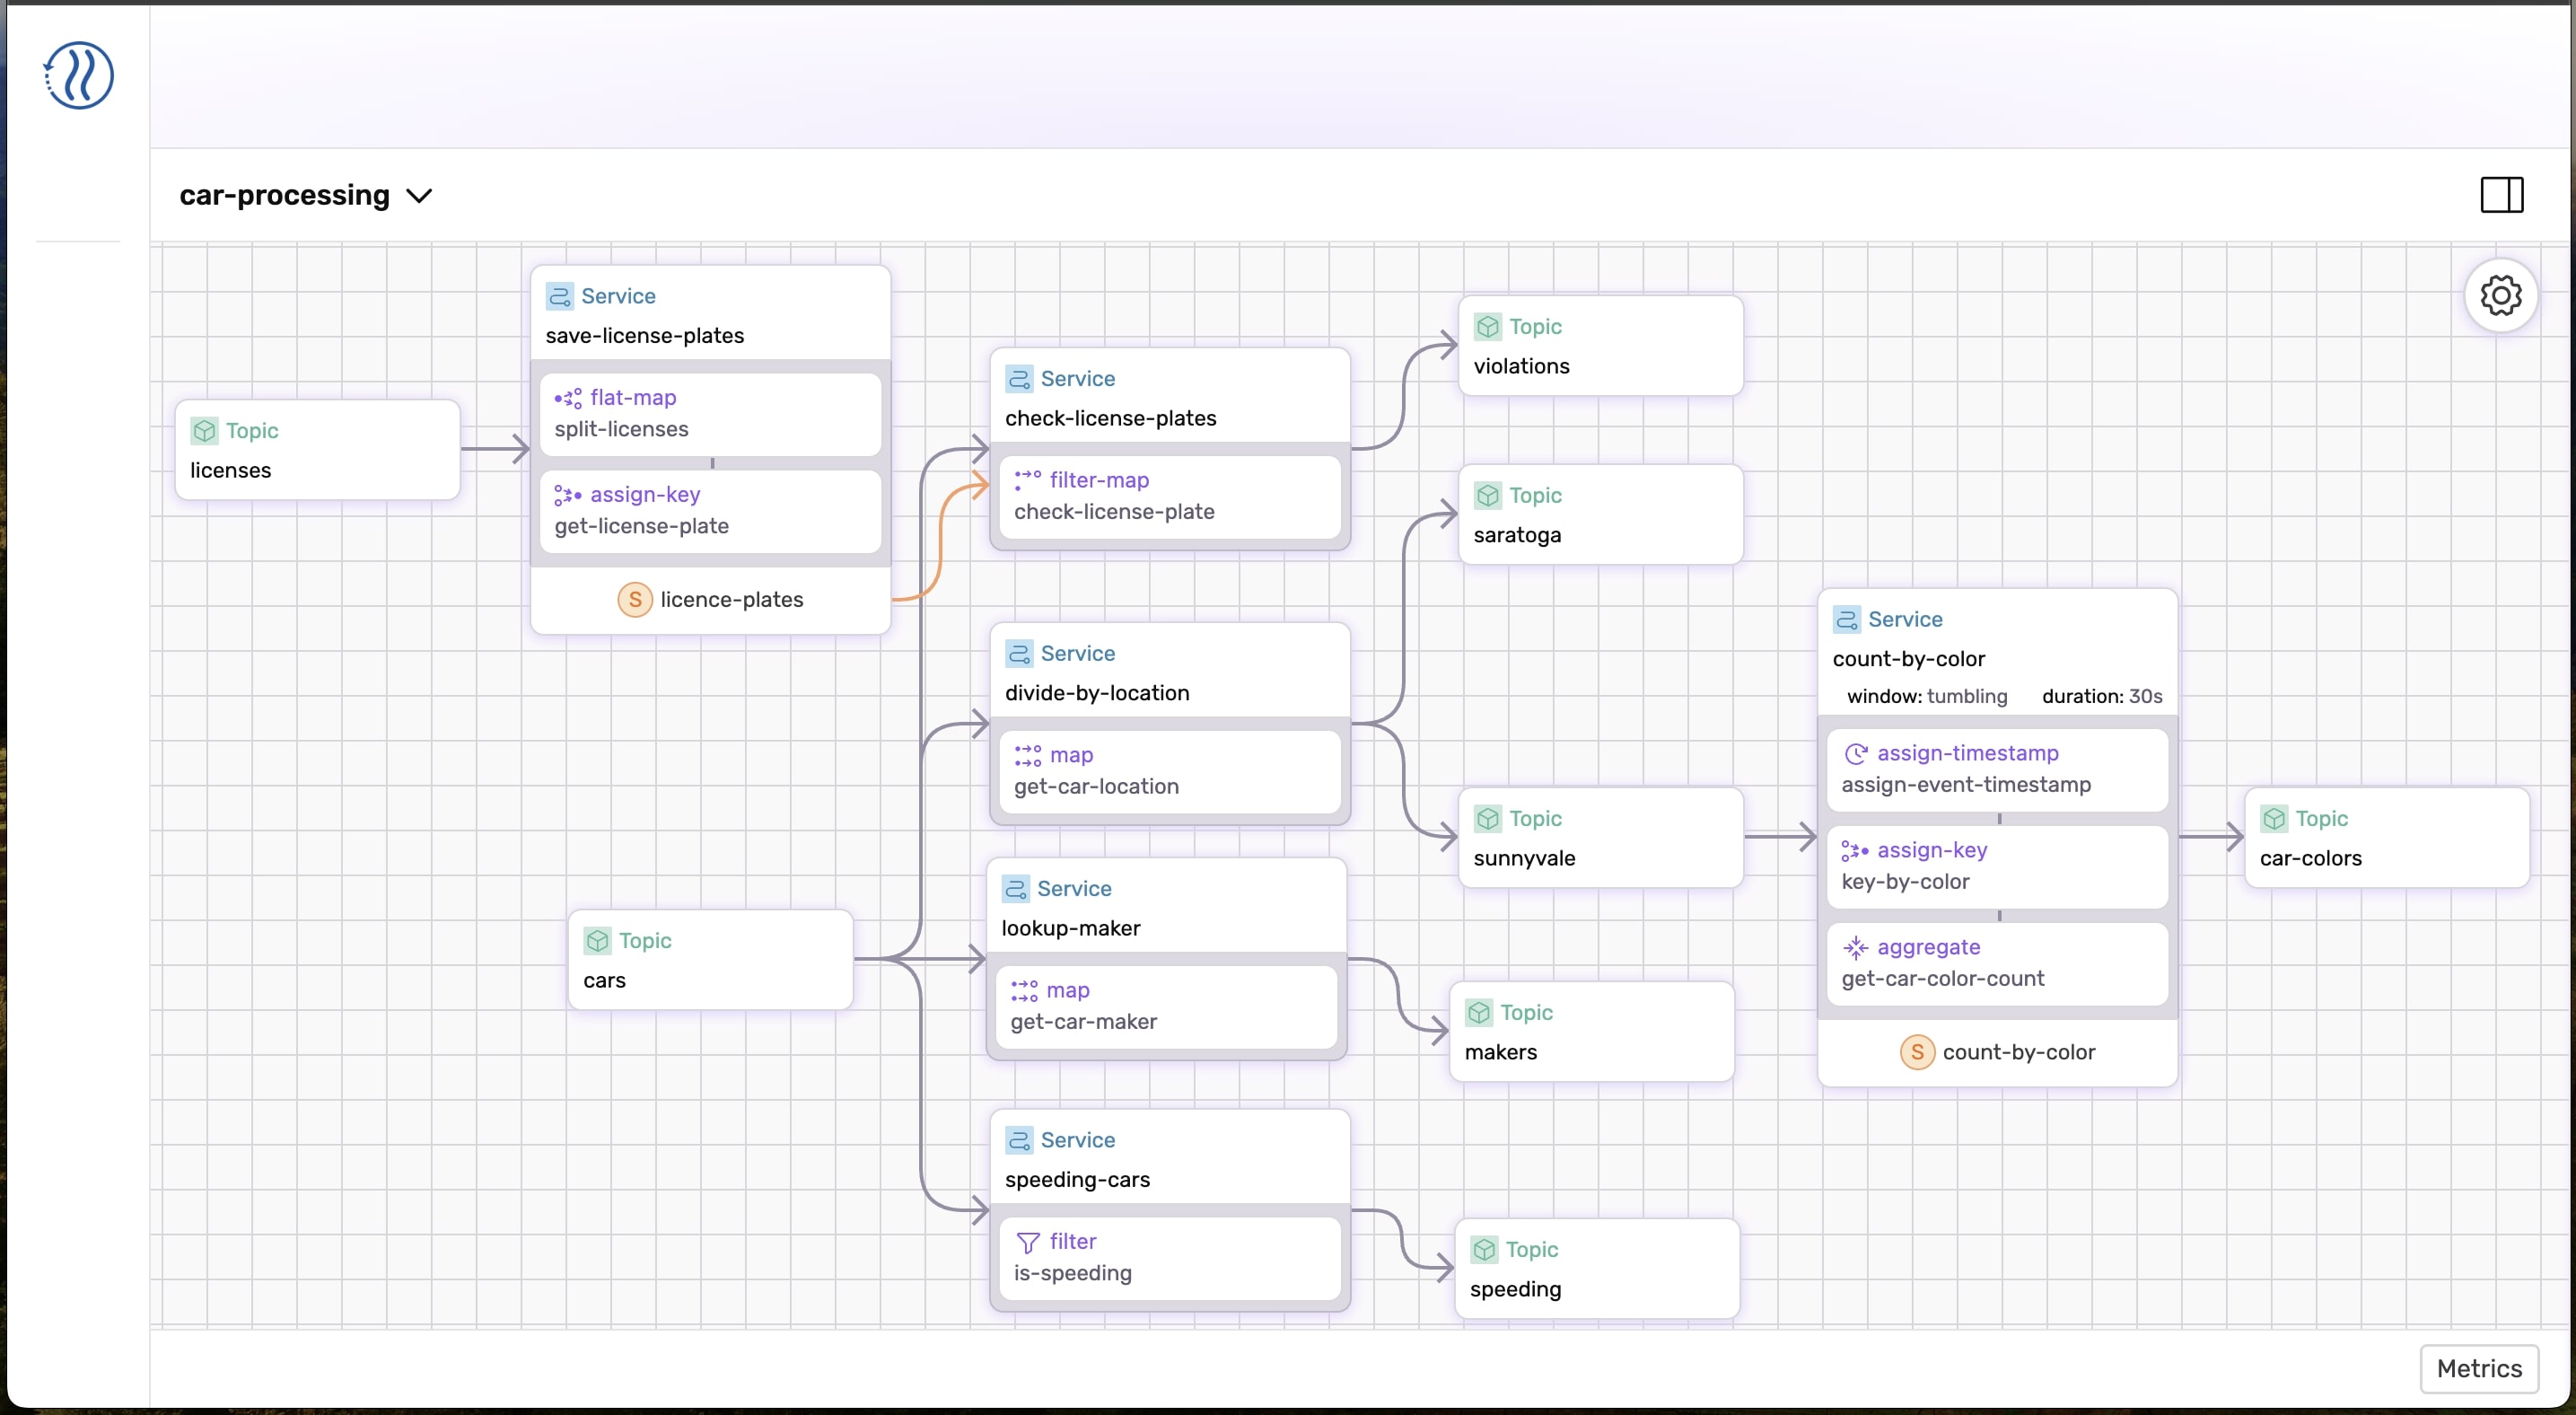
SDF Studio is the official user interface for Stateful Dataflows. Studio can be used to visualize dataflow graphs and view relevant metrics.

Using SDF Studio in Infinyon Cloud
Infinyon Cloud users can find the application on the Infinyon Cloud website.
Running SDF Studio in a self-hosted environment
Self-hosted SDF users can deploy the SDF Studio webserver locally via the SDF CLI.
When running a dataflow without a worker:
$> sdf run --ui
When deploying to a worker:
$> sdf deploy --ui
Note: the --port flag can be used to specify a custom port whenever the --ui flag is provided.
Visualizing a dataflow
Most of the dataflow structure will be apparent by viewing the graph rendered by SDF studio. The graph has two types of nodes, which represent your topics and services. You will also notices two types of edges. Grey edges, which indicate a topic is acting as a source or sink for a service, and orange edges which indicate a service is referencing a state object owned by another service.
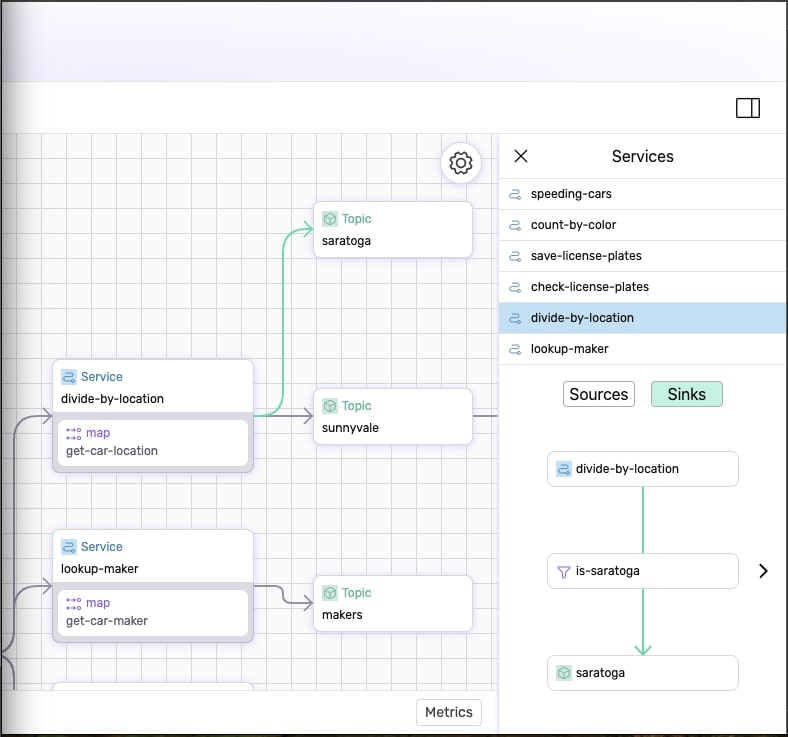
Clicking a grey edge will open an info bar to the right with additional details about the source/sink relationship.

Viewing Metrics
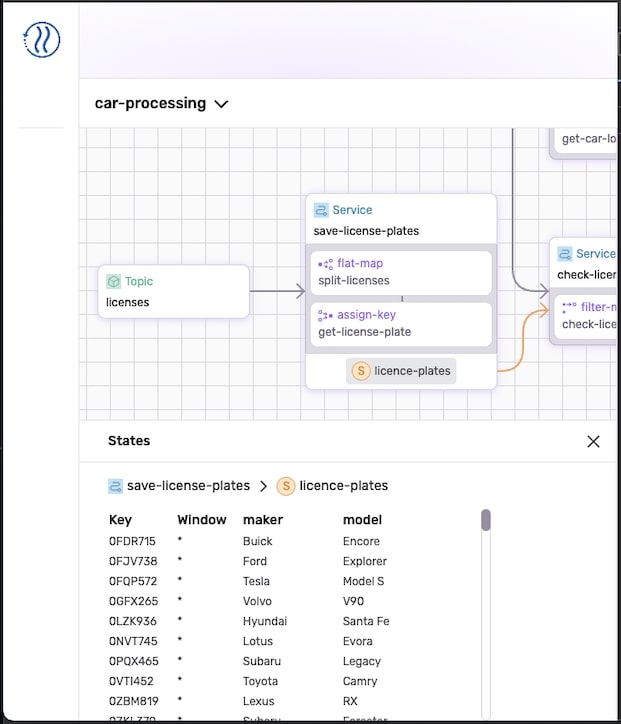
SDF State objects can be viewed in a table format either by clicking on the state object directly on the service that owns it, or by clicking on the "Metrics" button on the bottom right of the page.
